Overview and charts
See revenue, costs and result by month, quarter or year.
Financial insight
View revenue, costs, profit and loss, balance sheet, equity, annual statement and VAT. UurKlus builds reports from your entries automatically.
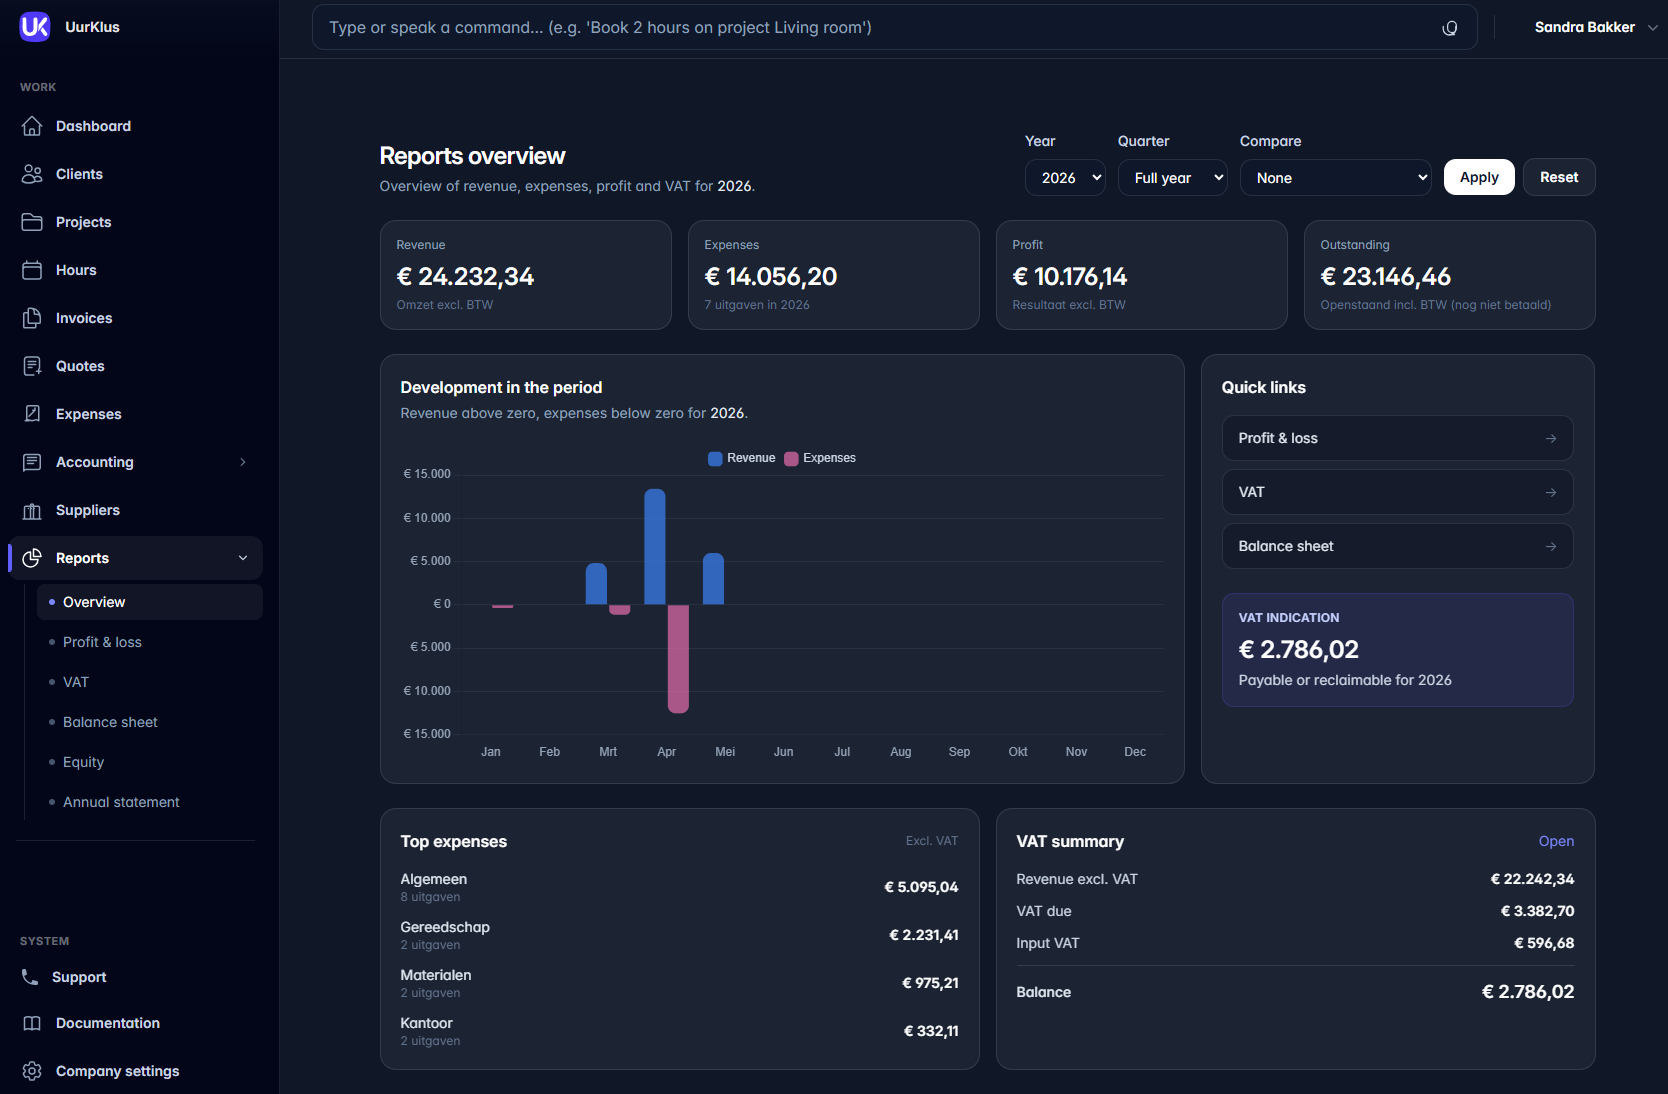
Reports and insight
Reports are built from time entries, invoices, expenses, payments and postings. No separate spreadsheet is needed next to your administration.
See revenue, costs and result by month, quarter or year.
Analyze income and expenses per period.
Use reports for tax filing, year-end work and accountant review.
Based on reporting
The feature page mentions charts by month, quarter or year, helping you quickly see how the business is doing.
See what you earn and spend. This report helps spot patterns in revenue and costs.
View assets, liabilities and equity to understand the financial position of your business.
The VAT report supports review, reconciliation and preparation. File externally, then record the matching report. The annual overview is based on postings and is not an income-tax or corporate-tax return; assess tax profit adjustments separately.
Workflow
Invoices, expenses, payments and postings form the basis.
Open overview, profit and loss, balance sheet, equity, VAT or annual statement.
Review what happens by month, quarter or year.
Review your result, discuss with your accountant or prepare filing and year-end work.